Towards understanding animal welfare: A Chicken Farm Monitoring System for Inferring AI-powered Analytics

Poultry Farm Innovation Project​

Poultry Farm Innovation Project​

PoultryFI projects aims at delivering high-quality analytics to farm chicken owners to facilitate their effords towards increasing revenue, acting promptly to potential flock-threatening hazzards and monitoring the wellfare and general condition of the chicken in the farm. To do this, a low cost monitoring system is installed in the farm and processes audio, video and environmental data constantly collected by deployed sensor modules.
 

Hardware/Architecture

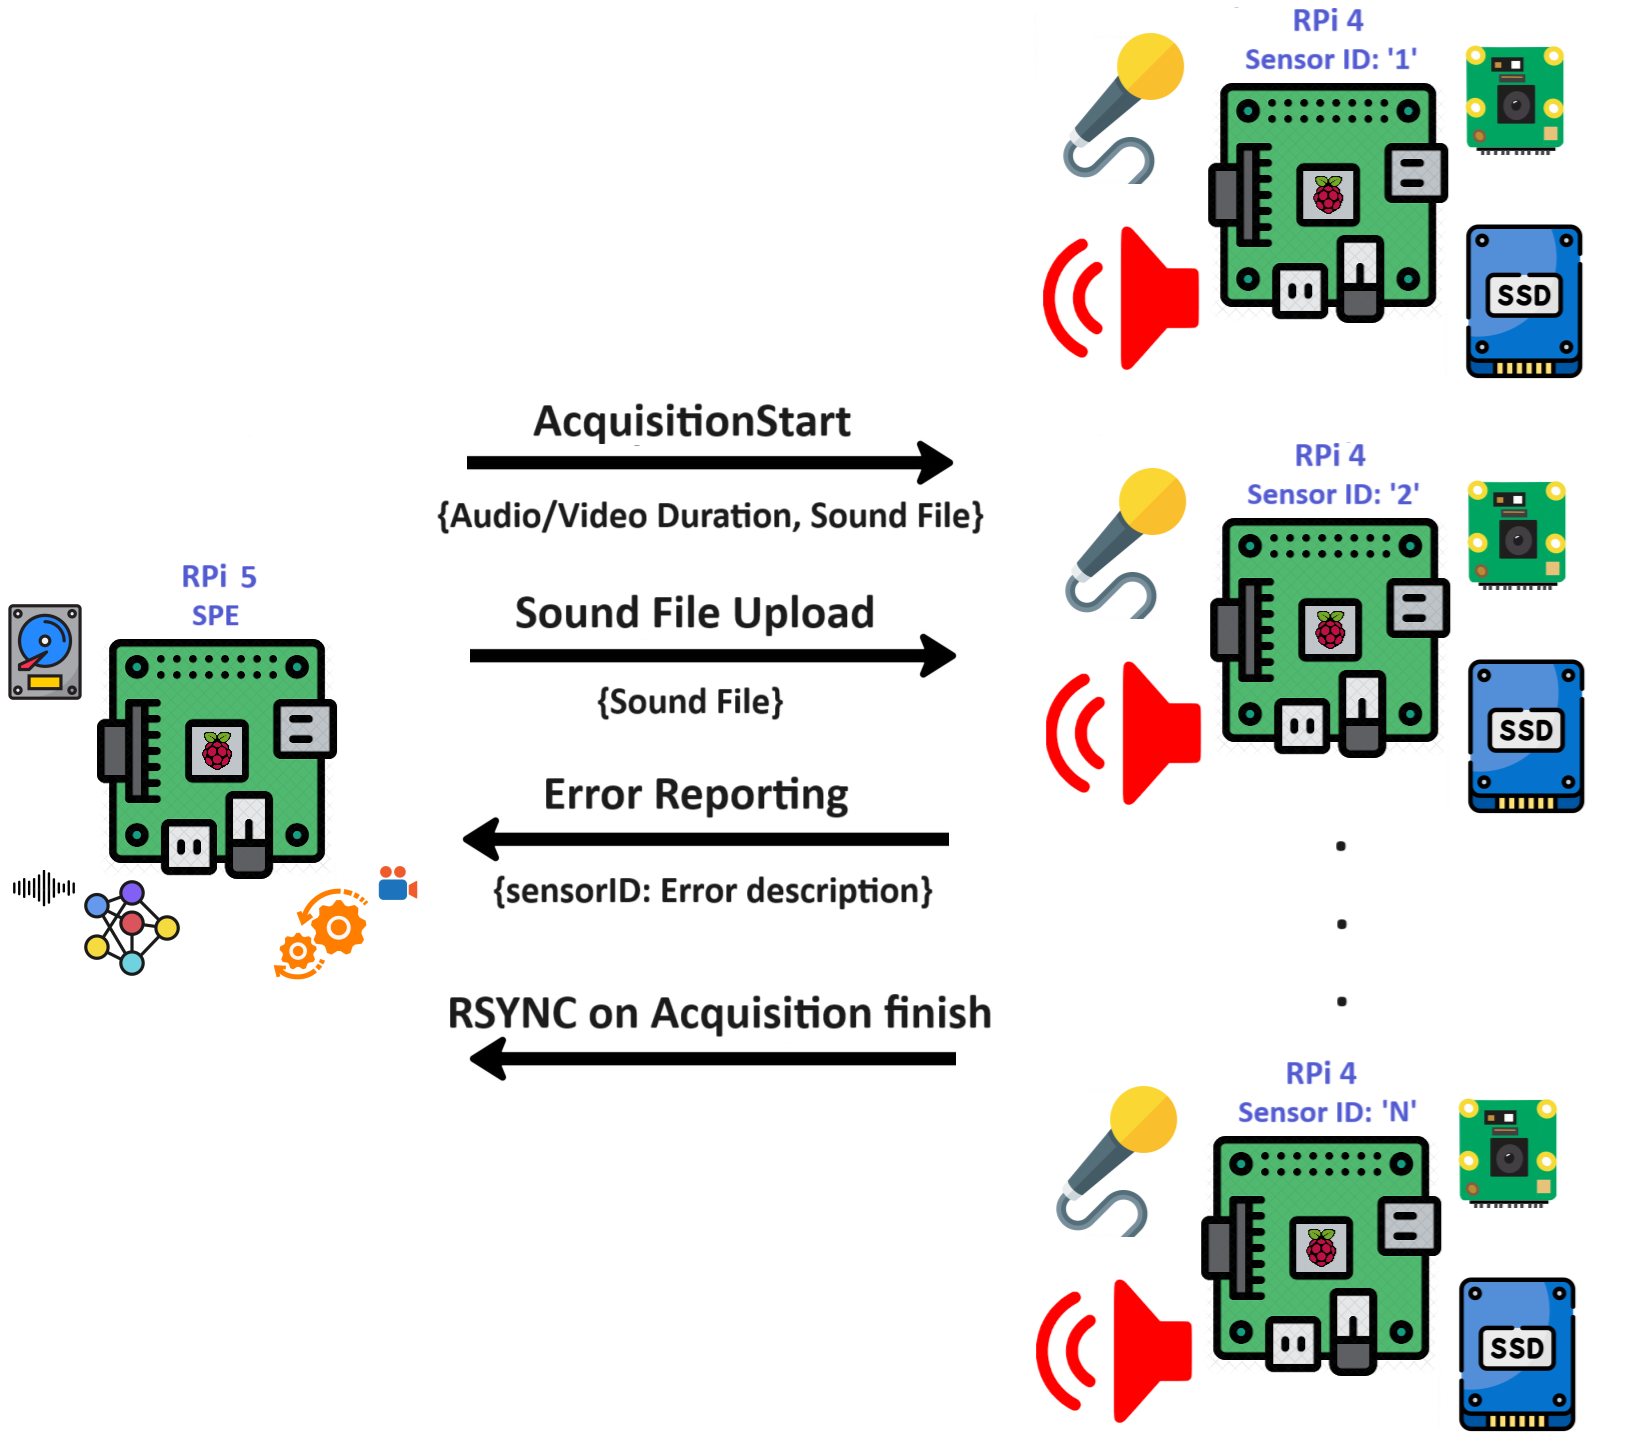
We use audio and video recordings of the flock to conduct inference on the condition of the animals on the farm. For the data acquisition we set up a network of sensory devices each equipped with a microphone, a camera, a speaker, a local storage device (Solid State Drive-SSD) for temporarily storing collected data and networking capabilities. The speakers will be used in the future for producing short sounds to assess the response of the flock to external stimuli. The heart of the system is a centralized device that synchronizes the acquisition conducted by the sensory devices over the network via Application Programming Interface (API) calls. The centralized device also acts as a Network Access Server (NAS) and Processing Engine (PE) that runs the audio Neural Network (NN) and the motion detection algorithm on the data (audio and video) captured by the sensory devices and sent to the NAS. We designed the hardware in such a way that important configuration parameters (e.g., acquisition interval, duration, external stimuli sound, network configuration like sensors’ IP addresses, etc.) are configurable on the centralized device that we call the Synchronization and Processing Engine (SPE). The SPE sends the external stimuli sound file to all sensors in the network during boot-up and implements API calls for conducting synchronization, status/error logging from sensors’ communication, hosts the NAS service, runs inference on the audio NN and runs the motion detection algorithm. The sensor devices capture audio/video streams in response to the synchronization messages sent by the SPE (the synchronization messages instruct the sensors of the duration of the imminent video/audio acquisitions). For all devices in the monitoring network, we use Raspberry Pi modules because they are flexible, support audio/video acquisition and provide a fair amount of processing power. Due to the more demanding operations hosted, the SPE is built around RPi model 5 and the sensor modules are built around RPi model 4.
Audio Anomaly Detection
The collected audio streams are transformed into Mel spectrograms and then processed by a convolutional denoising autoencoder. We use Mel spectrograms because they offer a more perceptually relevant representation of audio signals that are aligned with human sound perception. Essentially, the audio streams are transformed into frequency domain filter banks that describe the sound signal in terms of its frequency content.
 

The Mel spectrograms provide a signature of the processed audio that reflects the psychological state of the chicken and thus enable the efficient learning of audio features in chicken clucking or any other sound made by the birds. To learn these audio features, we use unsupervised learning and thus no annotations are required. Specifically, we apply a convolutional denoising autoencoder that learns to reconstruct the Mel spectrograms from their noisy versions.

By learning to restore the true values of the spectrograms, the model learns the features of the problem domain and thus becomes capable of identifying the peculiarities of the data. In other words, the model learns the manifold of the data and distills the low-level audio characteristics that comprise the data. To infer the psychological state of the flock we observe the manifold location where unseen audio samples are mapped on. Since different positions on the manifold reflect different acoustic characteristics, the psychological state of the chicken that causes certain vocal characteristics can be inferred in terms of the mapping of the audio features.

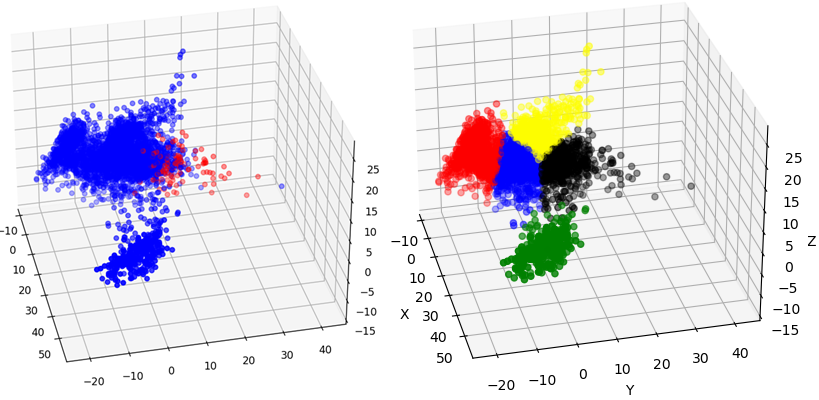
We use PCA to reduce the dimensionality of the audio embeddings to a 3-D space to link the audio semantics of the data points with their distribution in space. Interestingly, the data points are distributed in the 3-D latent space in a way that points with similar semantics are feature-mapped close to each other. For example, most of the audio data points that contain very soft clucking are mapped close to each other at a certain region of the latent space. Likewise, most of the audio data points that contain the clucking of rather stressed chicken are mapped close to each other at a certain region of the feature space. Most importantly, most of the anomalous points (data points with the highest reconstruction error) contain sounds of panicked birds that make distinct sounds of despair.We further cluster the 3-D embeddings with the k-means algorithm into 5 regions. The choice of using 5 regions lies with the way the embeddings are spread onto the feature space. The left figure below shows the 3-D feature space and the data points with the highest reconstruction error are displayed in red color. The right figure below shows the 5 clusters computed with k-means with each cluster shown in a different color. Each cluster computed by the k-means contains semantically different sounds: the points in the red cluster represent low-intensity sounds (flock resting and being very calm), points in the blue cluster represent normal soft clucking, yellow points calm clucking and ambient noises (like food-delivery-machinery), black points represent flock noises ranging from clucking of medium intensity to extremely loud flock sounds (panic sounds) and green points represent very soft clucking and ambient noise (mainly fans blowing air in the farm to cool down the flock). Most importantly, we observe that the anomalous points (the ones with the highest reconstruction loss are located at the extremities of the black cluster (medium to extreme noises).
Below we provide a video that demonstrates this analysis with sound to show the different sound semantics of the various clusters.
Motion Detection
Besides the audio-based anomaly detection, we developed a simple motion detection system that aggregates the motion of the chicken in the flock. It works by conducting background subtraction on subsequent frames of the captured images. A video demo of the motion detector is shown below.
Integrating Audio, Video and Sensory data to infer analytics
The audio-based anomaly detector and the video-based motion detection sub-systems directly provide the means to generate alerts to the farm personnel regarding the status of the flock. Besides the direct detection of unpleasant situations, the combination of multi-modal data (audio streams, video streams and sensory data) into a unified framework can be utilized to assess the welfare of the chicken. By combining the data, we expect to get reliable indicators that the farm owner can exploit to manage the farm better in terms of improving the welfare of the flock, increasing the revenue and preventing catastrophic events, or mitigating the effects of unpleasant situations that reduce the life expectancy of the chickens. The output of such a system could comprise powerful analytics that are not easy to infer while managing the farm and are not, to our knowledge, available by any commercial system. Some possible analytics we aspire to provide to the farm management and their probable interpretations are the following:
• The average flock motion yesterday was 30% lower than the average daily flock motion of last week. This may be a sign of underfeeding, extreme temperature or environmental hazards like high ammonia.
• The average flock motion during the last 3 days was 70% lower than last month’s average. This may indicate a serious condition like illness.
• Last week’s audio-based anomaly detections were 300% higher than all this year’s weekly detections. This might be an indicator of an intruder.
• Average flock motion during feeding time is 140% higher than usual. Maybe this is a sign of underfeeding.
• Deploy the environmental data acquisition and integrate with audio and video analytics.
• Deploy a functionality for recording flock’s response to external stimuli (sound). This will provide indicators of the flock’s physical condition.
• Integrate daily production statistics, e.g., produced egg counts
• Deploy a unified framework that combines all availabel data to infer valuable analytics to the farm management
 
Next Steps


• Deploy a functionality for recording flock’s response to external stimuli (sound). This will provide indicators of the flock’s physical condition.
• Integrate daily production statistics, e.g., produced egg counts
• Deploy a unified framework that combines all availabel data to infer valuable analytics to the farm management
 
Project Contributors

Cyens Center of Excellence
1 Plateia Dimarchou Lellou,
Nicosia 1016, Cyprus

Algolysis Ltd
Archiepiskopou Makariou III 200, Lakatamia 2311, Nicosia, Cyprus